Daniel Lusher
GIS Analyst

Senior GIS Programmer/Analyst at Quartic Solutions, LLC
Email
or contact me via:
![]()
![]()
Maps
Line 109 Replacement
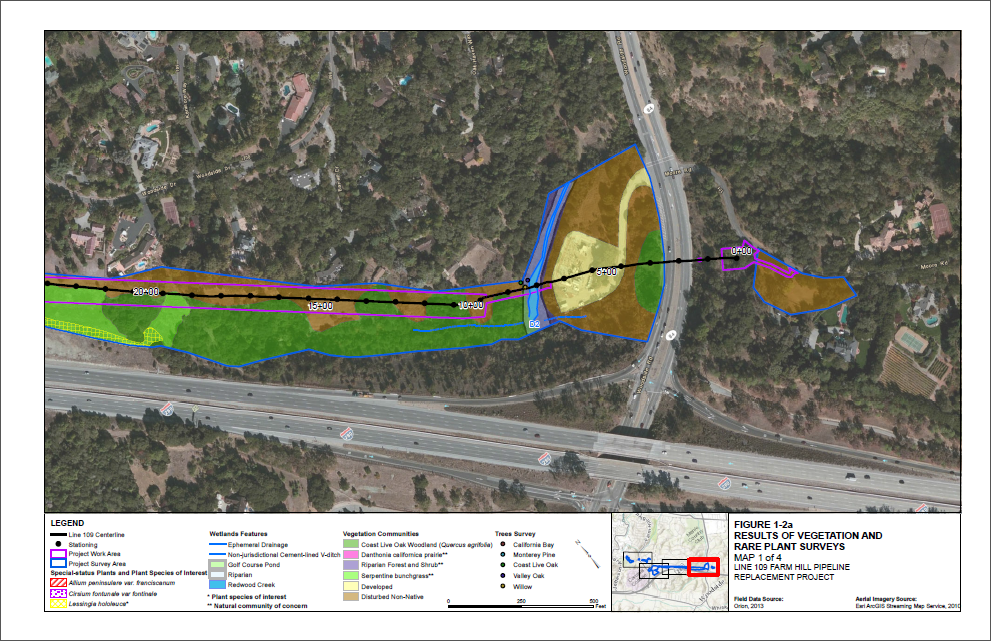
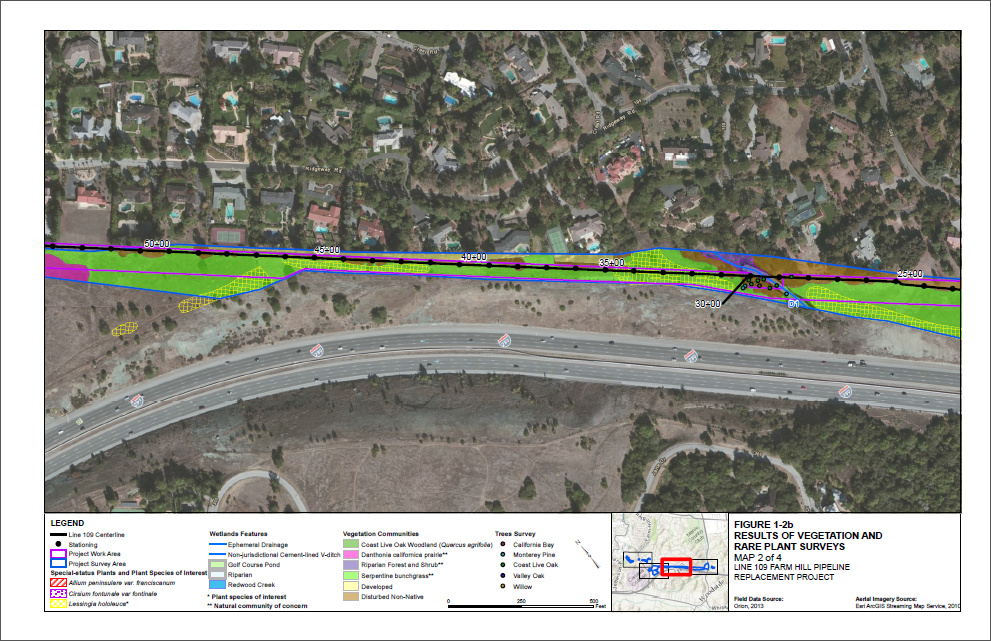
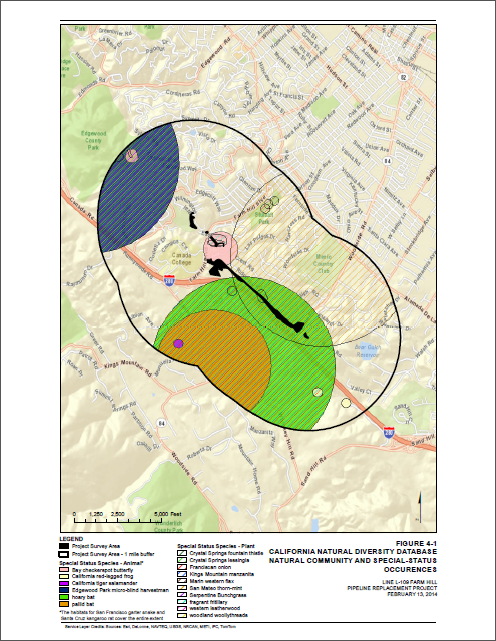
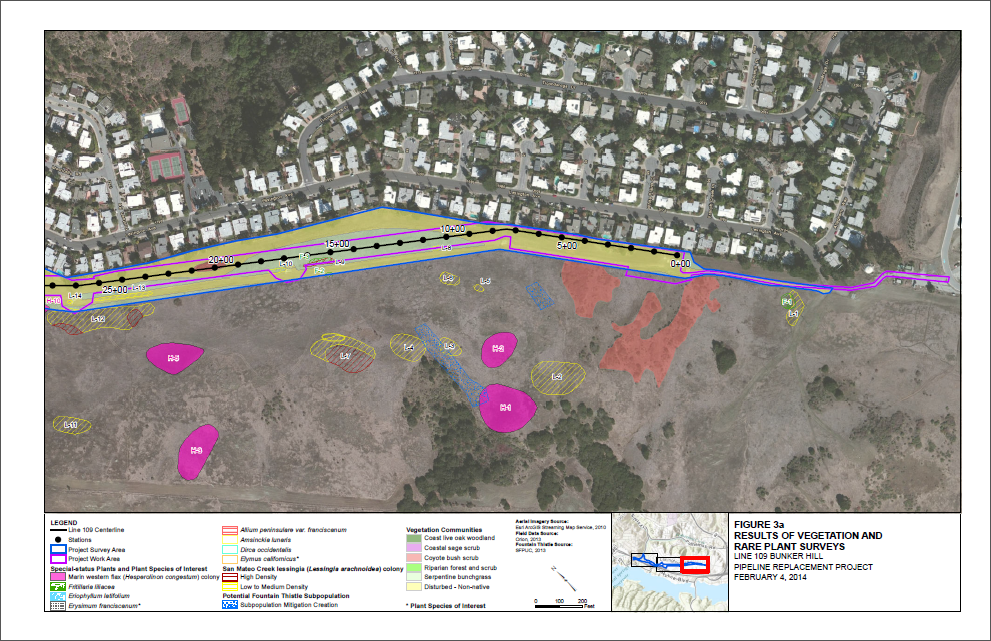
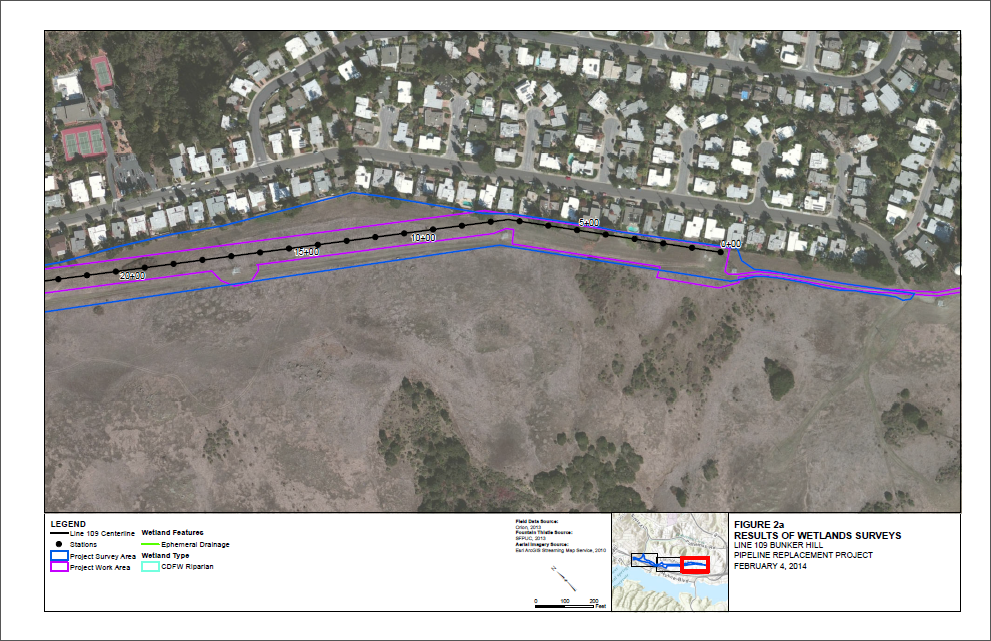
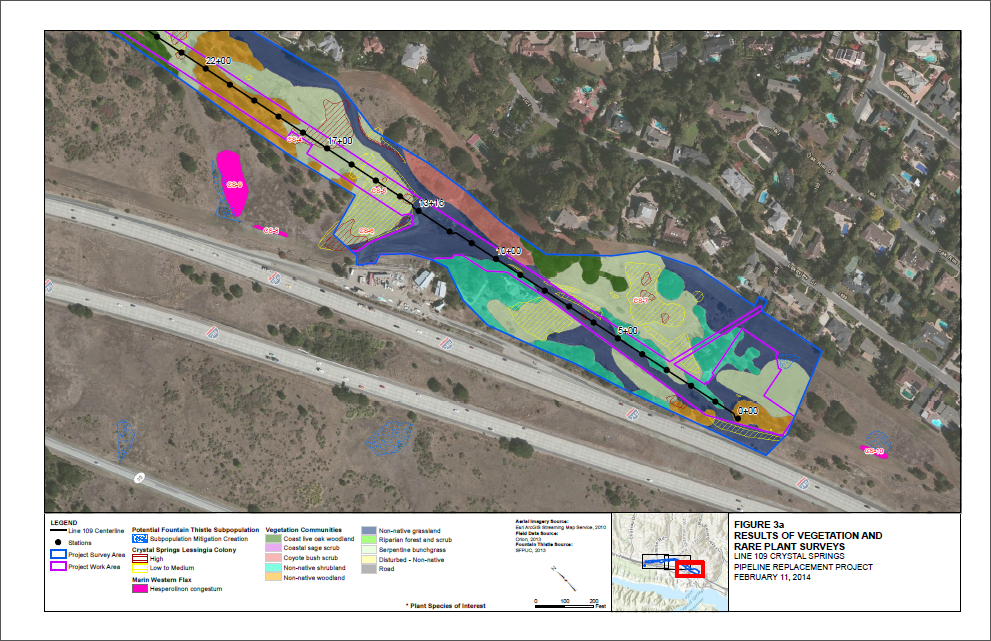
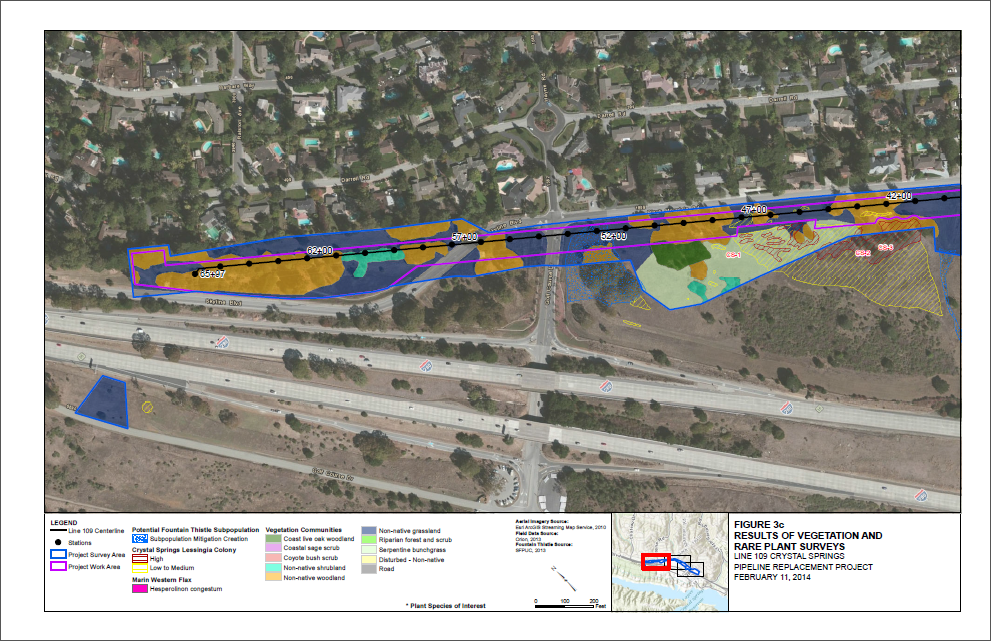
While working at IGIS Technologies, I worked on creating maps to be included in a permit application. In order to replace pipeline 109, owned by Pacific Gas and Electric (PG&E), an environmental assessment was required. The resulting data from the environmental assessment was sent to me as a KMZ file, and I imported the information into an ESRI geodatabase for mapping. There were several areas that required wetlands maps and rare plants maps, and one location that also required a California Natural Diversity Database map.
The data was created by Chem2Hill, and a partial template was sent to me. All credit for the data belongs to Chem2Hill and their contractors. All rights to the data and maps belong to Chem2Hill, and written permission from the data owner must be obtained before replication.
Farm Hill
Bunker Hill
Crystal Springs
Special Study with San Diego Canyonlands
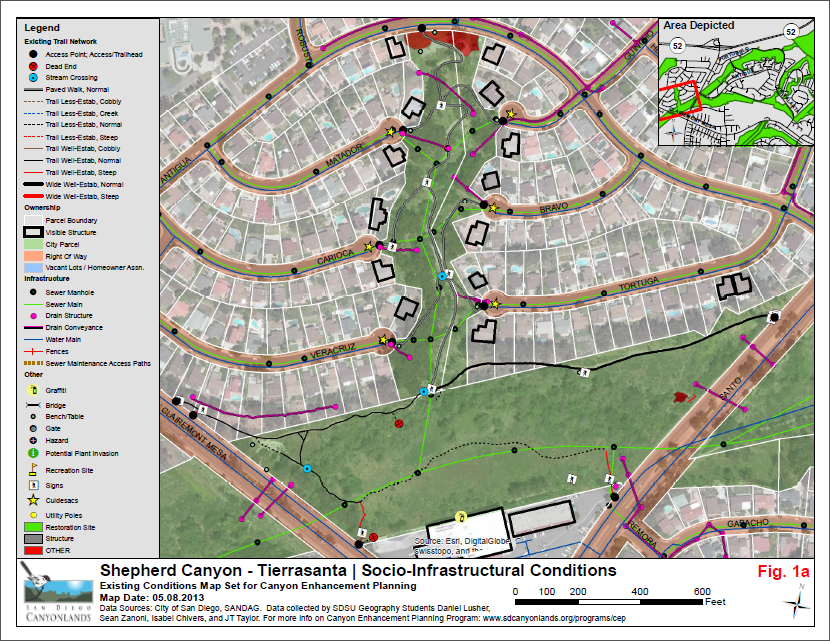
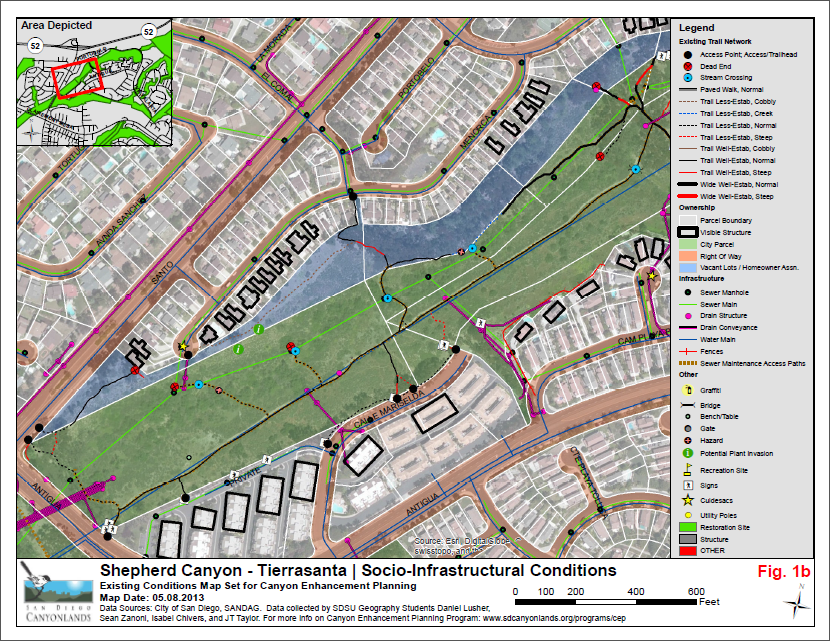
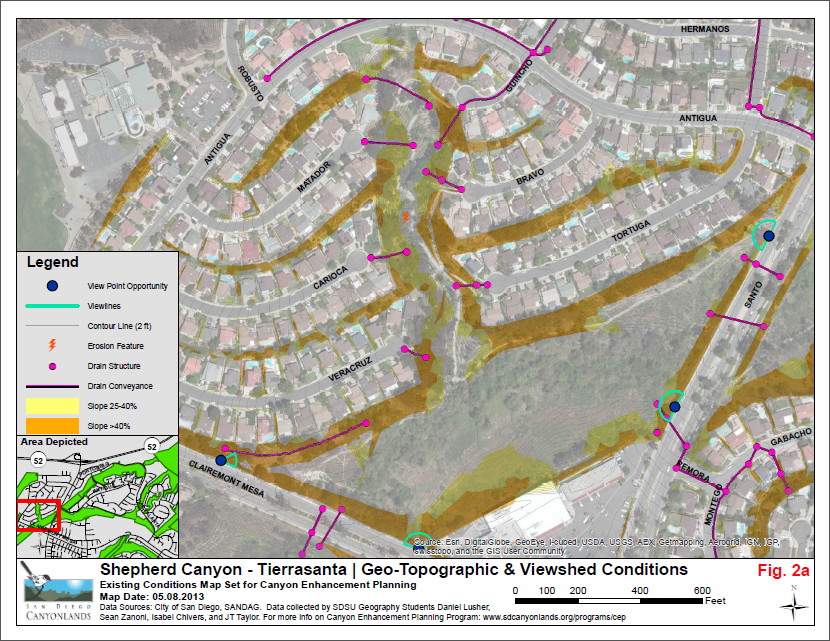
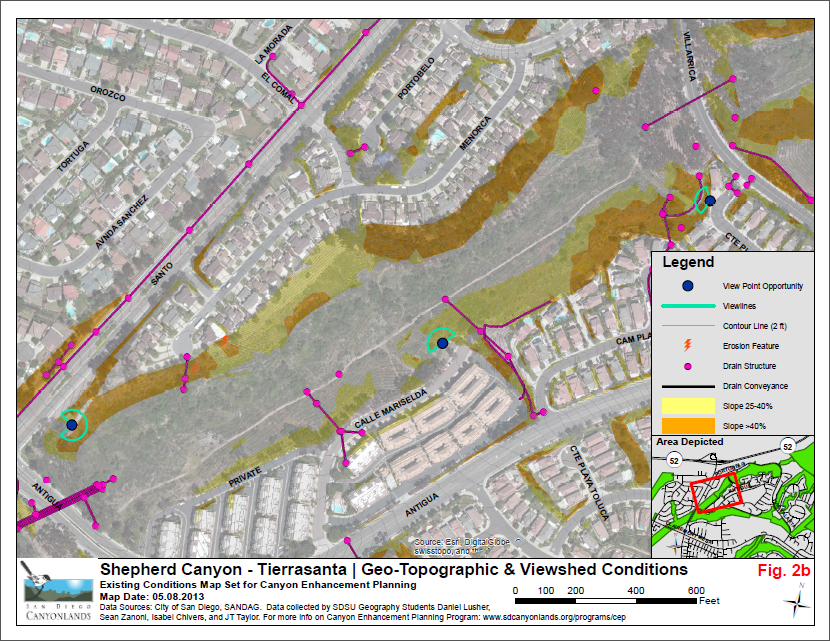
During my Spring 2013 semester at San Diego State University, I was part of a special study course that partnered with local non-profit San Diego Canyonlands. The class members were broken into three groups, and each group was assigned a canyon. My group was assigned the northern area of Shepherds Canyon, near Tierrasanta, and I led the group as we collected GPS points and lines for canyon features, and later created maps using this data. Some examples of the final maps are shown below.
The other members of my group were Isabel Chivers, Sean Zanoni, and JT Taylor.
Socio-Infrastructural Conditions
Geo-Topographic and Viewshed Conditions
GEOG3314 (Cartography)
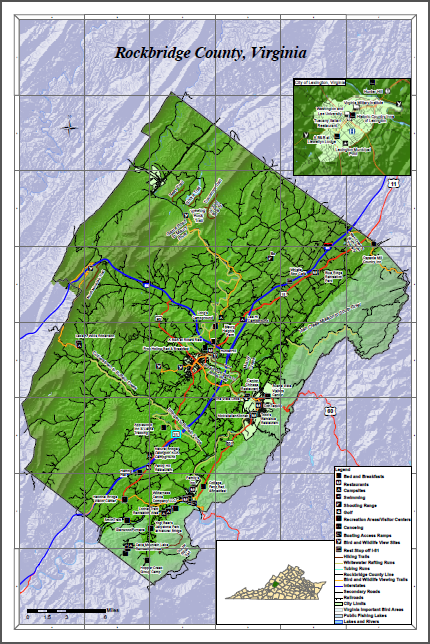
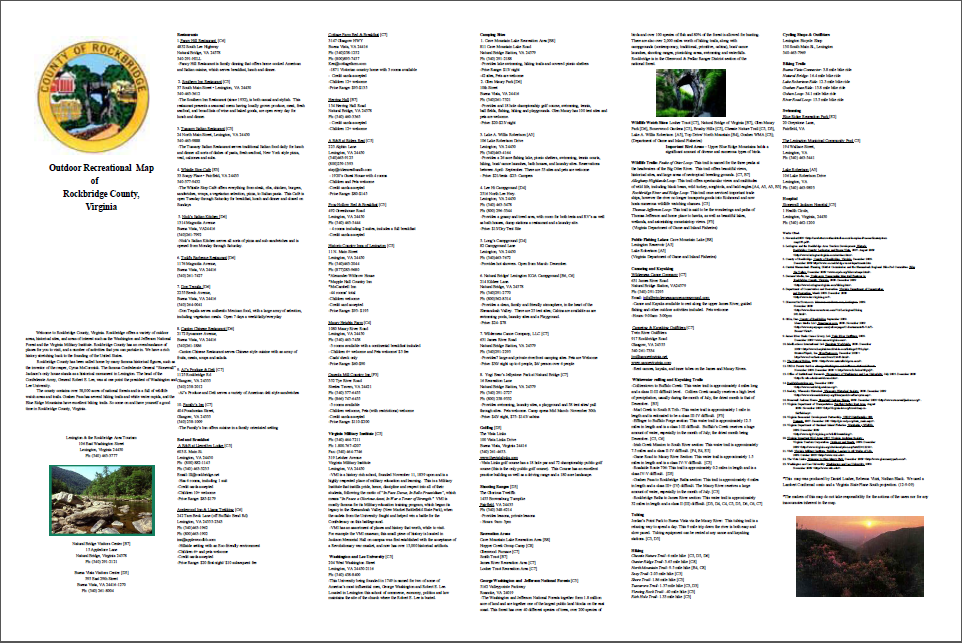
During my Fall 2010 semester at Virginia Tech, I took GEOG3314 (Cartography). The class was broken into one semester long-project and several smaller mapping projects, all done in a group setting. The semester long project was to create a recreation map for a county in Virginia; in my case, Rockbridge County. The recreation map needed to include any sort of recreation activities (hiking, rafting, biking), and features that would be helpful for visitors (hotels, restaurants, campsites). In addition to the map, a backpanel that included detailed information on each feature was required.
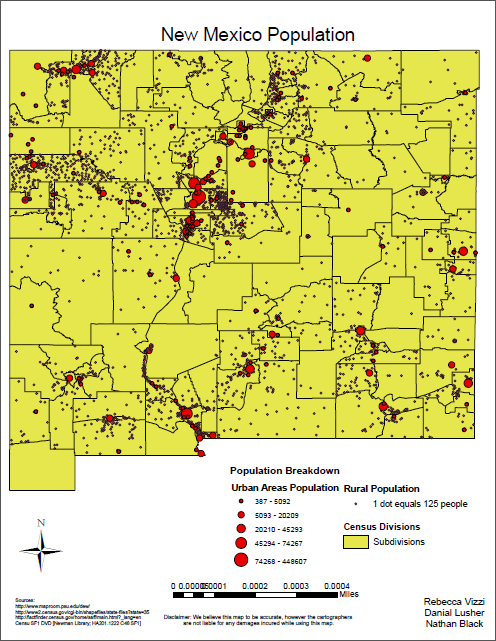
For the smaller mapping projects, one project was to map the population of US Census subdivisions for a particular state; in my case, New Mexico. A major requirement was to place the dots along areas that were actually populated; for example, no dots in lakes. To do this, we took a dataset of Interstate and major highways, buffered the line data, and restricted the random dot placement tool to this polygon.
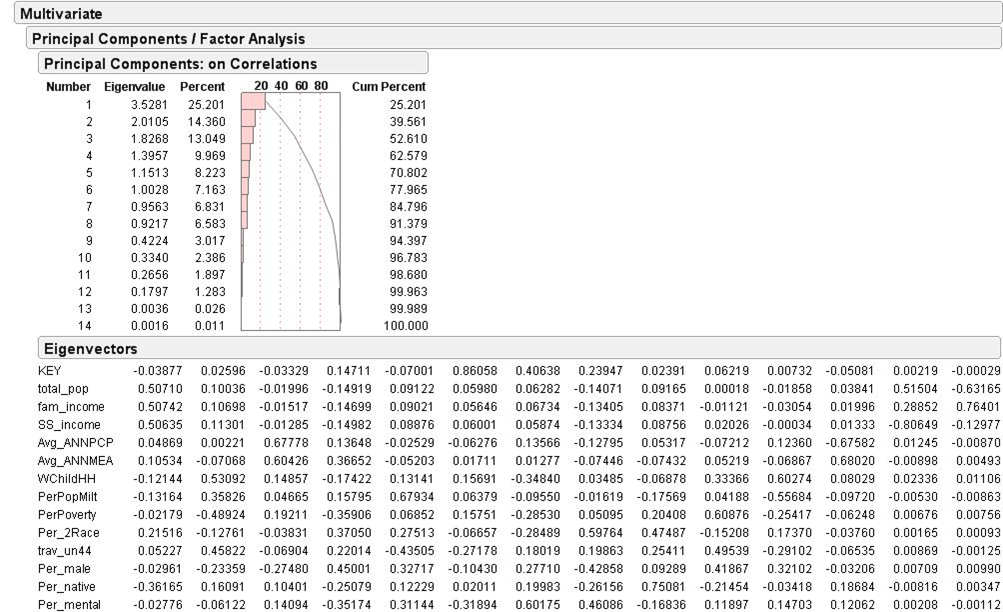
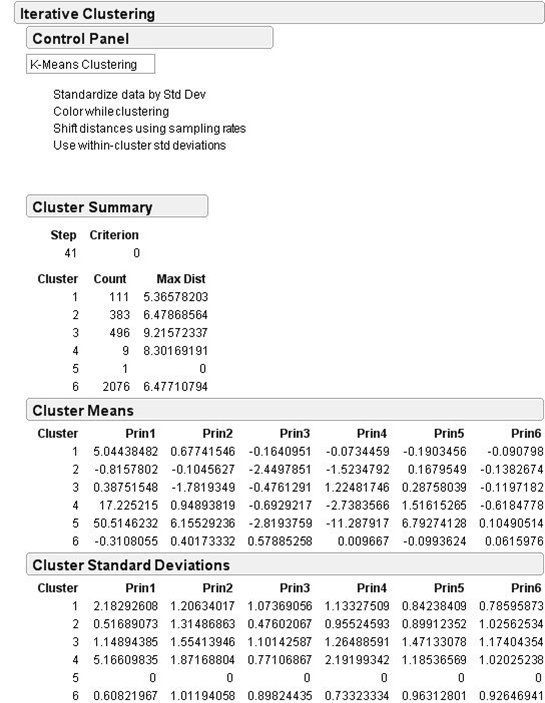
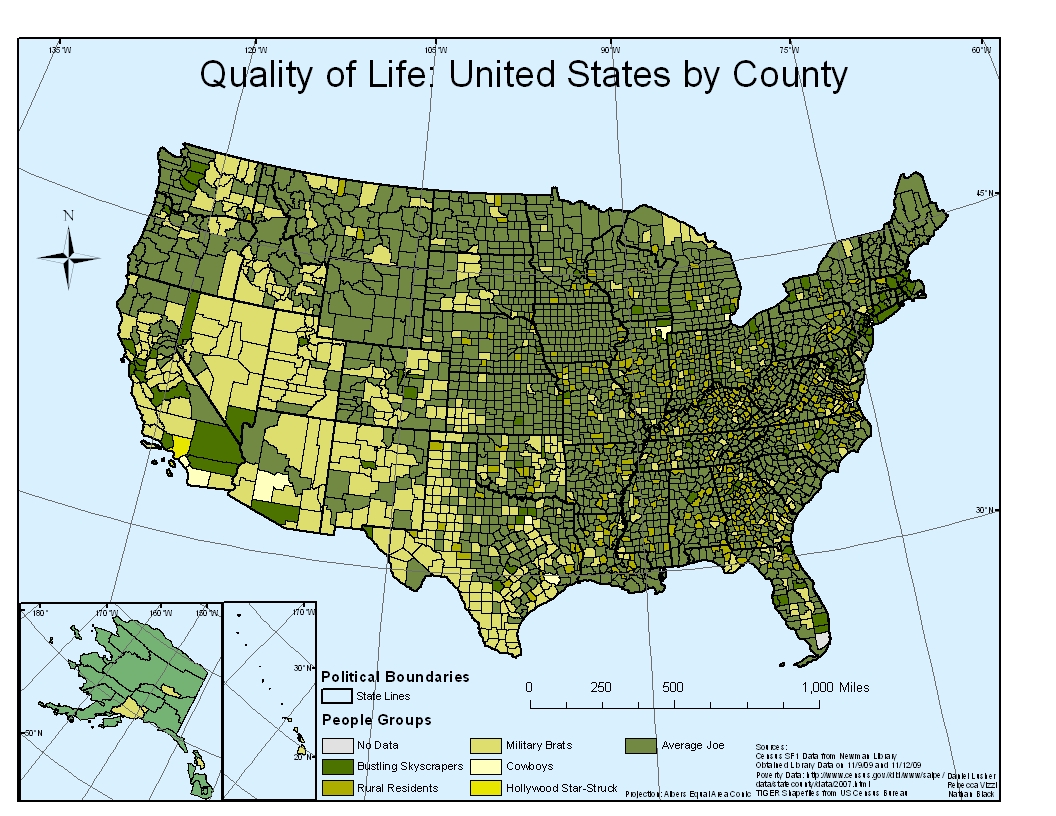
Another of the smaller mapping project included an look at US counties using Principal Component Analysis. We took thirty variables (including total population, family household income, percent of population in military, etc), ran a principal component analysis to categorize particular counties, and mapped the results. Overall, there were six factors that we mapped. I've included screenshots of the PCA and the final maps.
The other members of my group were Rebecca Vizzi and Nathan Black.
Rockbridge County Recreation Map
New Mexico Population, by US Census Subdivisions
County Population Characteristics, using Principal Component Analysis